Analytics & Visualization
We analyse large volumes of data and build dynamic, AI-based systems that visualize it in interactive dashboards and generate reports automatically.
Talk to us about your data →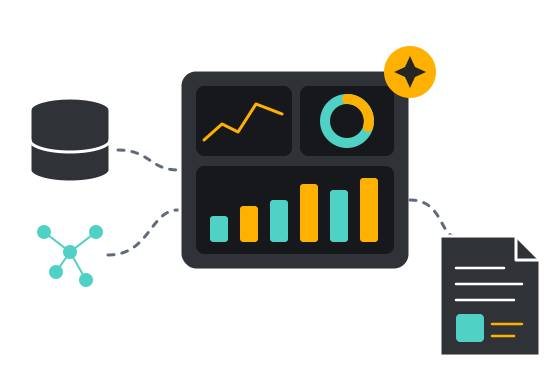
From raw data to dashboards and AI-written reports
Determinant Studios helps organisations make sense of large and fast-growing data. We engineer the data pipelines, apply analytics and AI, and deliver dynamic systems that visualize your data and generate reports, so your teams spend less time compiling numbers and more time acting on them.
Large-scale data engineering
Pipelines that collect, clean and combine large volumes of data from databases, APIs, files, devices and IoT sensors into one reliable source.
Advanced analytics & machine learning
Statistical analysis, forecasting, anomaly detection and segmentation that uncover the patterns and trends hidden in your data.
Interactive, real-time dashboards
Fast, drill-down dashboards and custom widgets for web and mobile, built around the decisions your teams need to make.
AI-generated reports
Dynamic AI systems that turn data into written reports, summaries and alerts, generated on schedule or on demand.
Conversational analytics
Ask questions about your data in plain language and get answers, charts and explanations from an AI assistant.
Custom & 3D visualization
Scientific charts, waveforms and WebGL-based 3D visualizations for data that standard charting tools cannot show well.
From data to decisions
Every analytics system we build follows the same path: reliable data in, trusted insights out, delivered where your people work.
- 1
Collect
Connect your data sources: databases, business systems, spreadsheets, APIs, devices and documents.
Unified data - 2
Process
Clean, validate and model the data at scale so it is accurate, consistent and ready for analysis.
Trusted dataset - 3
Analyse
Apply statistics, machine learning and AI to find trends, forecasts, outliers and root causes.
Insights - 4
Visualize
Present results in interactive dashboards and visualizations that update as new data arrives.
Live dashboards - 5
Report & Act
Generate AI-written reports and alerts, and push insights to the people and systems that act on them.
Automated reports
What you can build with your data
Typical analytics and visualization systems we design and deliver:
Executive & operations dashboards
One real-time view of KPIs, operations and performance across teams, sites and systems.
Dashboards · Real-time dataAutomated business reporting
Weekly and monthly reports written and distributed automatically, with AI summaries of what changed and why.
AI reports · SchedulingIoT & device data monitoring
Stream and analyse sensor and device data, with alerts when readings drift or anomalies appear.
IoT · Anomaly detectionScientific & lab data analysis
Tools for scientists and labs to analyse waveforms, measurements and images, and compare results over time.
Scientific visualizationDocument & financial data extraction
Extract structured data from invoices and documents with OCR and AI, then analyse and report on it.
OCR · AI extractionCustomer & product analytics
Understand how customers use your product, where they drop off and which features drive growth.
Product analyticsData and visualization we have shipped
Examples from our own products and client work:
Common questions
How much data can you work with?
We design pipelines and storage around your data volume and growth, from a few systems and spreadsheets to large, continuously streaming datasets from devices and applications.
Can you work with our existing BI tools and databases?
Yes. We can connect to your existing databases and data warehouse, extend the BI tools you already use, or build custom dashboards where off-the-shelf tools fall short.
What does an AI-generated report look like?
It combines charts and tables with written commentary produced by an AI model from your data, for example a summary of key changes, likely causes and items that need attention. Reports can run on a schedule or be generated on demand.
How do you make sure AI-generated insights are accurate?
AI-written text is grounded in the underlying data and calculations, figures are computed by the data pipeline rather than invented by the model, and important reports can include human review before they are sent.
Related services
You call it a challenge ?
We're ready , bring it on.

